How Do I Run JavaScript in Chrome?
Run JavaScript In Chrome in Your browser allows you to do a lot of things – from getting mac & cheese delivered to video chatting with your friends. It’s all thanks to the power of JavaScript.
You can use Chrome Dev Tools to inspect & edit DOM & style attributes as well as view & run JavaScript code. It also offers a call stack to help you debug your program.
Running JavaScript in Chrome involves a variety of approaches, depending on your specific use case. Below is a comprehensive guide covering different methods, from simple browser console execution to more complex scenarios like debugging and running scripts in a local environment.
Basic JavaScript Execution in Chrome:
1. Using the Browser Console:
- Open Chrome and navigate to the webpage where you want to run JavaScript.
- Right-click on the page and select “Inspect” or press
Ctrl + Shift + I(Windows/Linux) orCmd + Opt + I(Mac) to open the DevTools. - Go to the “Console” tab.
- Type or paste your JavaScript code and press
Enterto execute.
2. Bookmarklet:
- Create a bookmark in Chrome.
- Right-click the bookmark bar, choose “Add page,” and set the name to something like “Run JavaScript.”
- In the URL field, enter
javascript:followed by your JavaScript code. - Click the bookmark when on a page to execute the code.
Advanced JavaScript Execution:
3. Executing External Scripts:
- Create an HTML file containing your JavaScript code.
- Open the HTML file in Chrome by dragging it into a new tab.
- Alternatively, serve the file using a local server, e.g., with the
Live Serverextension.
4. Using Developer Tools:
- Open DevTools (
Ctrl + Shift + IorCmd + Opt + I). - Go to the “Sources” tab.
- Navigate to the file you want to run or add your code directly.
- Right-click and choose “Run” or set breakpoints for debugging.
5. Debugging JavaScript:
- Open DevTools and go to the “Sources” tab.
- Set breakpoints by clicking on line numbers.
- Use the “Debugger” tab to step through code and inspect variables.
Local Development Environment:
6. Setting Up a Local Server:
- Install Node.js if not already installed.
- Use
npm install -g http-serverto install the HTTP server globally. - Navigate to your project folder in the terminal and run
http-server. - Open Chrome and access your project at
http://localhost:8080(or the specified port).
7. Using Browser Extensions:
- Extensions like “Code Injector” allow injecting and running custom JavaScript on web pages.
- Install the extension, open its options, and enter your JavaScript code.
Handling External Libraries:
8. Loading External Libraries:
- Use a CDN or download libraries like jQuery.
- Include the script tag in your HTML file or dynamically inject it using JavaScript.
<script src="https://code.jquery.com/jquery-3.6.0.min.js"></script>
Security Considerations:
9. Content Security Policy (CSP):
- Some websites implement CSP, which restricts the execution of inline scripts.
- Adjust your code or use a browser extension that bypasses CSP for testing.
Enable JavaScript
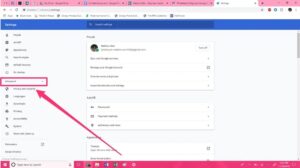
To enable JavaScript, click the button that looks like three dots on top of each other in the upper-right corner of your Chrome browser window. This will reveal the settings menu. Click the Site settings option, which is near the bottom of the list.
The Site settings page will show you a list of sites and their configuration. Most websites require JS to function properly. If you disable it, most interactive elements that make them work won’t load on your computer. Additionally, features such as infographics and payment gateways may not work at all.
JavaScript is a powerful and widely used programming language that caters dynamic behavior of webpages. However, it’s also a popular attack vector for malware and phishing attacks. As such, it’s important to keep JavaScript enabled on your device. The good news is that it’s easy to enable. Here’s how to do it in just five steps. (Note: these steps are for Chrome on Windows 10. For iOS/iPadOS, go to the menu (3-dot icon at top right) – Settings – Privacy and security – Site settings – JavaScript). The switch should be set to “Allow” by default.
Create a.js file
A js file is a text file that contains JavaScript code. This code is executed by the browser to produce web pages. Using the Chrome dev tools, you can create and run a js file to test JS code on HTML elements. The Chrome dev tools also allow you to re-execute the same code after modifying the HTML element.
The DOM, or Document Object Model, is an important component of a web page. This is because it handles the interface that makes a website user-friendly and responsive to mobile devices. In addition, it helps developers identify and resolve errors in the JavaScript-based program.
To view the source of a webpage, you can either press the Ctrl+U keyboard shortcut or right-click on an empty area of the web page and select “View page source”. Both methods will display the HTML source code of the webpage. If there is a js file on the webpage, the script type=”text/javascript”> tag in the HTML will be displayed as a hyperlink.
Inspect element
Inspect element is a powerful tool for web developers. It allows them to access a website’s source code and inspect its innards. It enables them to see how long it takes for the site to load, the exact color used in its text, and the JavaScript code that powers animations.
To use this tool, users must first open a webpage or site in Chrome. They can then right click anywhere in the browser window and select Inspect element. They can also click the menu icon (three dots in the top-right corner of the browser) and select More tools > Web developer tools or use a keyboard shortcut like command+option+I on Mac and Ctrl+Shift+I on Windows.
Once the Web Developer Tools have opened, users can click anywhere in the page to access the DOM tree. They can then choose an element and click inspect to view its details. They can also set breakpoints in the JS file to debug their code. These include conditional breakpoints, uncaught exception breakpoints, and XHR breakpoints.
Run a.js file
JS is a programming language that defines the structure of a webpage and its content. It is also used to support math calculations, fetch data from other websites and create dynamic style declarations. It can be difficult to learn how to use JS but once you know the basics you can build beautiful web pages and apps. To get started, enrol in Lighthouse Lab’s free JavaScript crash course.
Chrome Dev Tools is a free tool that helps you debug and test your javascript code. It allows you to inspect HTML, DOM and CSS (Cascading Style Sheets). It can also help you fix cross-browser compatibility issues. You can also pause a script so that you can view the state of the window or DOM at that time.
To open Chrome Dev Tools, press F12 on your keyboard or right-click anywhere in the browser. Once it opens, select the “Sources” tab and then click + New snippet.
Conclusion:
Running JavaScript in Chrome can be as simple as using the browser console or as sophisticated as setting up a local development environment. Choose the method that best suits your needs, considering factors like debugging, external libraries, and security considerations. Always be mindful of the environment in which you are executing JavaScript, especially when dealing with external code or scripts on webpages.
Leave a Reply